Grundläggande statistik
| Institutionella ägare | 92 total, 78 long only, 1 short only, 13 long/short - change of 75,00% MRQ |
| Genomsnittlig portföljallokering | 0.0003 % - change of 4 767,23% MRQ |
| Institutionella aktier (lång) | 18 187 486 (ex 13D/G) - change of 0,02MM shares 212,80% MRQ |
| Institutionellt värde (lång) | $ 242 191 USD ($1000) |
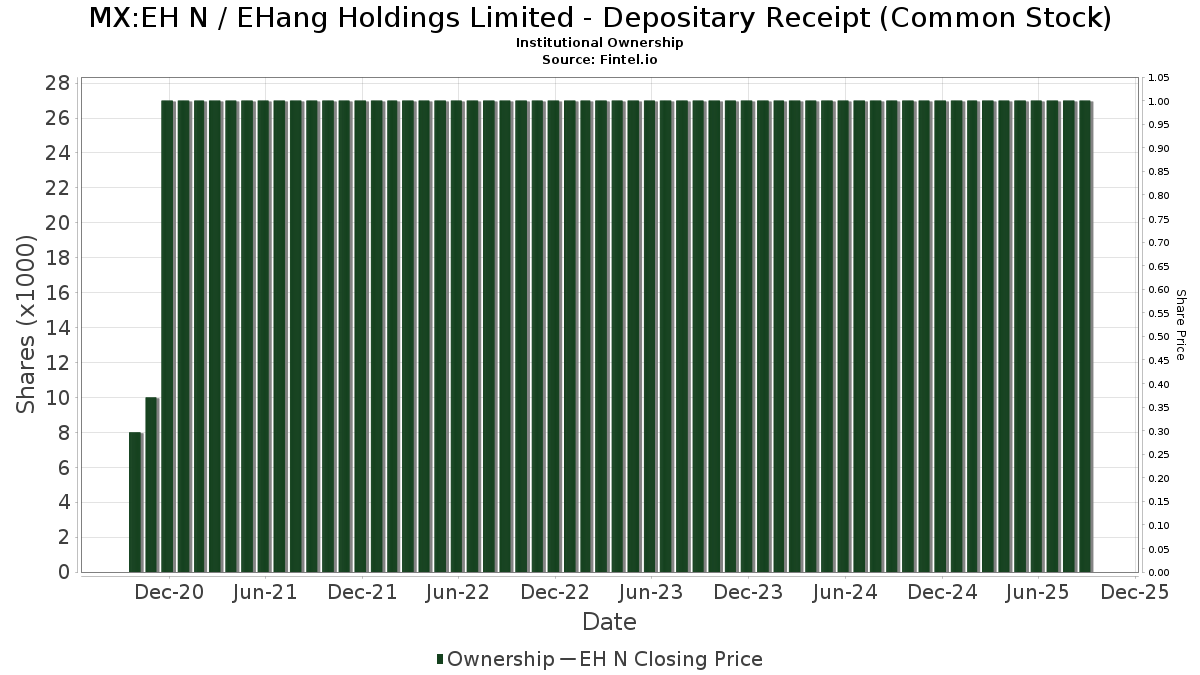
Institutionellt ägande och aktieägare
EHang Holdings Limited - Depositary Receipt (Common Stock) (MX:EH N) har 92 Institutionella ägare och aktieägare som har lämnat in 13D/G- eller 13F-formulär till Securities Exchange Commission (SEC). Dessa institut innehar totalt 18,187,486 aktier. Största aktieägare inkluderar Axim Planning & Wealth, Susquehanna International Group, Llp, Vanguard Group Inc, Jane Street Group, Llc, FIL Ltd, State Street Corp, Morgan Stanley, UBS Group AG, Susquehanna International Group, Llp, and Citadel Advisors Llc .
EHang Holdings Limited - Depositary Receipt (Common Stock) (BMV:EH N) Institutionell ägarstruktur visar institutioners och fonders nuvarande positioner i företaget, samt de senaste förändringarna i positionernas storlek. Större aktieägare kan vara enskilda investerare, fonder, hedgefonder eller institutioner. Bilaga 13D visar att investeraren äger (eller ägde) mer än 5% av företaget och avser (eller avsåg) att aktivt eftersträva en förändring av affärsstrategin. Schedule 13G indikerar en passiv investering på över 5%.
Fondsentimentets poäng
Fondsentimentet poängen(fka Ägarackumulation-poäng) visar vilka aktier som är mest köpta av fonder. Det är resultatet av en sofistikerad kvantitativ flerfaktormodell som identifierar företag med de högsta nivåerna av institutionell ackumulering. Poängsättningsmodellen använder en kombination av den totala ökningen av redovisade ägare, förändringarna i portföljallokeringarna för dessa ägare och andra mått. Siffran sträcker sig från 0 till 100, där högre siffror indikerar en högre nivå av ackumulering i förhållande till sina konkurrenter, och 50 är genomsnittet.
Uppdateringsfrekvens: Dagligen
Se Ownership Explorer, som innehåller en lista över de högst rankade företagen.
AI+ Ask Fintel’s AI assistant about EHang Holdings Limited - Depositary Receipt (Common Stock).
Select a question to share a public post with an AI-crafted answer.
Thinking of good questions…
13F- och NPORT-arkiveringar
Detaljer om 13F-arkiveringar är gratis. Detaljer om NP-arkiveringar kräver ett premiummedlemskap. Gröna rader indikerar nya positioner. Röda rader indikerar stängda positioner. Klicka på länk symbolen för att se hela transaktionshistoriken.
Uppgradera
för att låsa upp premiumdata och exportera till Excel ![]() .
.
| Fil Datum | Källa | Investerare | Typ | Genomsnittligt pris (beräknat) |
Aktier | Δ Aktier (%) |
Rapporterat värde (1000 USD) |
Δ Värde (%) |
Portföljallokering (%) |
|
|---|---|---|---|---|---|---|---|---|---|---|
| 2026-02-13 | 13F | Peak6 Llc | Call | 742 900 | −38,39 | 9 791 | −56,28 | |||
| 2025-11-14 | 13F | Hrt Financial Lp | 0 | −100,00 | 0 | |||||
| 2026-02-13 | 13F | Peak6 Llc | Put | 1 200 | −85,54 | 16 | −90,26 | |||
| 2026-02-06 | 13F | IFP Advisors, Inc | 894 | 0,00 | 12 | −31,25 | ||||
| 2026-02-10 | 13F | Exit Wealth Advisors, LLC. | 0 | −100,00 | 0 | −100,00 | ||||
| 2026-02-03 | 13F | SBI Securities Co., Ltd. | 24 241 | −5,12 | 319 | −32,70 | ||||
| 2026-02-13 | 13F | Eschler Asset Management LLP | 0 | −100,00 | 0 | |||||
| 2026-01-27 | 13F | TD Waterhouse Canada Inc. | 82 | 1 | ||||||
| 2026-02-11 | 13F | Simplex Trading, Llc | Put | 87 900 | −77,54 | 1 159 | 16 442,86 | |||
| 2026-02-11 | 13F | Simplex Trading, Llc | 310 067 | 19,87 | 4 087 | 102 050,00 | ||||
| 2026-02-10 | 13F | Root Financial Partners, LLC | 200 | 0,00 | 3 | −33,33 | ||||
| 2026-02-17 | 13F | Quadrature Capital Ltd | 0 | −100,00 | 0 | |||||
| 2026-02-12 | 13F | Federation des caisses Desjardins du Quebec | 251 | 0,00 | 3 | −25,00 | ||||
| 2026-02-13 | 13F | Wilkerson Advisory Group LLC | 55 | 1 | ||||||
| 2026-02-17 | 13F | Turim 21 Investimentos Ltda. | 501 | 0,00 | 7 | −33,33 | ||||
| 2026-01-29 | 13F | Vanguard Group Inc | 2 040 225 | 0,87 | 26 890 | −28,41 | ||||
| 2025-09-26 | NP | UGPIX - UltraChina ProFund Investor Class | 3 114 | 64,67 | 54 | 74,19 | ||||
| 2026-02-13 | 13F | Morgan Stanley | 993 583 | 226,68 | 13 095 | 131,85 | ||||
| 2026-02-17 | 13F | Jones Financial Companies Lllp | 0 | −100,00 | 0 | |||||
| 2026-02-13 | 13F | Hel Ved Capital Management Ltd | 198 031 | 0,00 | 2 610 | −29,02 | ||||
| 2025-11-14 | 13F | Lighthouse Investment Partners, LLC | 0 | −100,00 | 0 | −100,00 | ||||
| 2026-02-10 | 13F | Daiwa Securities Group Inc. | 4 816 | 47,59 | 0 | |||||
| 2026-03-03 | 13F/A | Caitong International Asset Management Co., Ltd | 144 | 2 | ||||||
| 2026-02-06 | 13F | FourThought Financial Partners, LLC | 14 429 | 190 | ||||||
| 2025-09-25 | NP | VGTSX - Vanguard Total International Stock Index Fund Investor Shares | 709 434 | 20,20 | 12 415 | 25,59 | ||||
| 2026-02-13 | 13F | Barclays Plc | 1 383 | −96,93 | 18 | −97,85 | ||||
| 2026-02-13 | 13F | Walleye Capital LLC | Call | 14 700 | 194 | |||||
| 2026-02-13 | 13F | Walleye Capital LLC | Put | 31 000 | 409 | |||||
| 2026-02-13 | 13F | Walleye Capital LLC | 1 | 0 | ||||||
| 2026-02-17 | 13F | Bank Of America Corp /de/ | 10 541 | −89,53 | 139 | −92,62 | ||||
| 2026-02-17 | 13F | Tower Research Capital LLC (TRC) | 639 | −36,29 | 8 | −55,56 | ||||
| 2025-10-15 | 13F | Cwm, Llc | 0 | −100,00 | 0 | |||||
| 2026-02-11 | 13F | Deutsche Bank Ag\ | 3 500 | 0,00 | 46 | −28,12 | ||||
| 2025-11-14 | 13F | Man Group plc | 0 | −100,00 | 0 | |||||
| 2025-09-23 | NP | SEKAX - DWS Emerging Markets Equity Fund Class A | 3 500 | 61 | ||||||
| 2026-02-13 | 13F | Quarry LP | 532 | 7 | ||||||
| 2026-02-06 | 13F | Leonteq Securities AG | 2 000 | −83,08 | 26 | −88,13 | ||||
| 2026-02-12 | 13F | BlackRock, Inc. | 48 685 | 105,45 | 642 | 45,68 | ||||
| 2026-02-17 | 13F | Advisor Group Holdings, Inc. | 325 | −98,73 | 4 | −99,16 | ||||
| 2026-02-20 | 13F | Sunbelt Securities, Inc. | 25 | 0,00 | 0 | |||||
| 2025-09-25 | NP | VEIEX - Vanguard Emerging Markets Stock Index Fund Investor Shares | 633 483 | 17,36 | 11 086 | 22,61 | ||||
| 2026-02-04 | 13F | Tsfg, Llc | 40 | 0,00 | 0 | |||||
| 2025-11-14 | 13F | Cubist Systematic Strategies, LLC | Call | 19 800 | 368 | |||||
| 2026-02-06 | 13F | Larson Financial Group LLC | 838 | 7,02 | 11 | −21,43 | ||||
| 2025-11-14 | 13F | Cubist Systematic Strategies, LLC | Put | 18 800 | 349 | |||||
| 2025-11-14 | 13F | Toronto Dominion Bank | 0 | −100,00 | 0 | |||||
| 2026-01-27 | 13F | WealthCollab, LLC | 20 | 0,00 | 0 | |||||
| 2025-11-06 | 13F | Ameritas Advisory Services, LLC | 0 | −100,00 | 0 | |||||
| 2026-02-11 | 13F | Jpmorgan Chase & Co | 8 087 | −3,77 | 107 | −32,05 | ||||
| 2026-02-13 | 13F | Rhumbline Advisers | 1 144 | −12,20 | 15 | −37,50 | ||||
| 2026-02-13 | 13F | Citigroup Inc | 10 560 | 5,40 | 139 | −25,27 | ||||
| 2026-01-21 | 13F | Sound Income Strategies, LLC | 45 | 0,00 | 1 | |||||
| 2025-10-31 | 13F | Y-Intercept (Hong Kong) Ltd | 0 | −100,00 | 0 | −100,00 | ||||
| 2025-11-14 | 13F | Point72 Europe (London) LLP | 33 600 | 624 | ||||||
| 2026-02-13 | 13F | Marshall Wace, Llp | 0 | −100,00 | 0 | −100,00 | ||||
| 2025-11-10 | 13F | Eleva Capital SAS | 0 | −100,00 | 0 | −100,00 | ||||
| 2026-01-29 | 13F | UBS Group AG | 941 689 | 19,03 | 12 411 | −15,52 | ||||
| 2026-02-09 | 13F | Legal & General Group Plc | 3 380 | 0,00 | 45 | −29,03 | ||||
| 2026-02-09 | 13F | Harbour Investments, Inc. | 10 | 0 | ||||||
| 2026-02-05 | 13F | Baader Bank INC | 20 000 | −20,00 | 264 | −43,32 | ||||
| 2026-02-11 | 13F | Group One Trading, L.p. | Put | 342 100 | −64,05 | 4 509 | −74,49 | |||
| 2026-02-09 | 13F | Geode Capital Management, Llc | 33 547 | 0,00 | 442 | −28,94 | ||||
| 2025-09-26 | NP | PGJ - Invesco Golden Dragon China ETF This fund is a listed as child fund of Invesco Ltd. and if that institution has disclosed ownership in this security, then these positions will not be double counted when calculating total shares and total value | 38 732 | −6,49 | 678 | −2,31 | ||||
| 2026-02-11 | 13F | Group One Trading, L.p. | 673 873 | −2,68 | 8 882 | −30,93 | ||||
| 2026-02-17 | 13F | Raymond James Financial Inc | 0 | −100,00 | 0 | |||||
| 2025-11-14 | 13F | XTX Topco Ltd | 0 | −100,00 | 0 | |||||
| 2026-02-13 | 13F | Walleye Trading LLC | Call | 10 900 | −16,15 | 144 | −40,66 | |||
| 2026-02-13 | 13F | Walleye Trading LLC | 206 341 | 54,16 | 2 720 | 9,42 | ||||
| 2026-01-30 | 13F | Bogart Wealth, LLC | 0 | −100,00 | 0 | −100,00 | ||||
| 2026-02-05 | 13F | Cambridge Investment Research Advisors, Inc. | 0 | −100,00 | 0 | |||||
| 2025-11-12 | 13F | Quantbot Technologies LP | 0 | −100,00 | 0 | |||||
| 2026-02-13 | 13F | Walleye Trading LLC | Put | 425 500 | −30,21 | 5 608 | −50,47 | |||
| 2025-11-13 | 13F | Russell Investments Group, Ltd. | 0 | −100,00 | 0 | −100,00 | ||||
| 2026-02-17 | 13F | Fmr Llc | 281 900 | 3 715 | ||||||
| 2025-11-14 | 13F | Millennium Management Llc | Call | 0 | −100,00 | 0 | −100,00 | |||
| 2026-02-13 | 13F | Cornerstone Financial Management LLC | 33 | 0 | ||||||
| 2025-11-14 | 13F | Millennium Management Llc | Put | 0 | −100,00 | 0 | −100,00 | |||
| 2026-01-14 | 13F | Hennion & Walsh Asset Management, Inc. | 31 883 | −6,53 | 420 | −33,65 | ||||
| 2026-02-13 | 13F | State Street Corp | 1 082 433 | 4,68 | 14 266 | −25,71 | ||||
| 2026-02-17 | 13F | Citadel Advisors Llc | Put | 152 000 | −76,22 | 2 003 | −83,12 | |||
| 2026-02-17 | 13F | Citadel Advisors Llc | 133 928 | −62,45 | 1 765 | −73,35 | ||||
| 2025-09-29 | NP | EVAV - Direxion Daily Electric and Autonomous Vehicles Bull 2X Shares | 6 841 | 23,64 | 120 | 29,35 | ||||
| 2026-02-10 | 13F | Bnp Paribas Arbitrage, Sa | 102 521 | 132,57 | 1 351 | 65,16 | ||||
| 2026-01-20 | 13F | Steel Peak Wealth Management LLC | 13 362 | −68,51 | 176 | −77,66 | ||||
| 2026-02-10 | 13F | Norges Bank | 541 048 | 7 131 | ||||||
| 2025-11-20 | 13F/A | Carrhae Capital LLP | 0 | −100,00 | 0 | −100,00 | ||||
| 2026-02-13 | 13F | Squarepoint Ops LLC | Put | 30 400 | −27,10 | 401 | −48,32 | |||
| 2026-02-13 | 13F | Squarepoint Ops LLC | 61 785 | 118,69 | 814 | 55,34 | ||||
| 2026-02-17 | 13F | Citadel Advisors Llc | Call | 786 800 | −0,77 | 10 370 | −29,57 | |||
| 2026-02-17 | 13F | Millennium Management Llc | 67 167 | 885 | ||||||
| 2026-01-07 | 13F | Aventura Private Wealth, LLC | 300 | 0,00 | 4 | −40,00 | ||||
| 2026-02-23 | 13F | Virtu Financial LLC | 13 865 | 0 | ||||||
| 2025-11-14 | 13F | Sig Brokerage, Lp | Call | 0 | −100,00 | 0 | −100,00 | |||
| 2026-02-12 | 13F | California Public Employees Retirement System | 54 408 | −0,08 | 717 | −29,08 | ||||
| 2025-11-14 | 13F | Caption Management, LLC | Call | 0 | −100,00 | 0 | −100,00 | |||
| 2026-02-13 | 13F | Headlands Technologies LLC | 30 020 | −54,21 | 396 | −67,54 | ||||
| 2026-02-13 | 13F | Wells Fargo & Company/mn | 1 373 | −95,91 | 18 | −97,12 | ||||
| 2026-03-06 | 13F | Hsbc Holdings Plc | 0 | −100,00 | 0 | |||||
| 2026-02-17 | 13F | Tudor Investment Corp Et Al | Put | 12 300 | 162 | |||||
| 2026-02-17 | 13F | Royal Bank Of Canada | 5 617 | −3,05 | 74 | −31,48 | ||||
| 2026-02-13 | 13F | Mml Investors Services, Llc | 0 | −100,00 | 0 | −100,00 | ||||
| 2026-02-17 | 13F | Schonfeld Strategic Advisors LLC | 16 672 | 220 | ||||||
| 2026-02-13 | 13F | Axim Planning & Wealth | Call | 67 600 | 36,57 | 891 | −3,16 | |||
| 2026-02-10 | 13F | Goldman Sachs Group Inc | 39 416 | −32,90 | 520 | −52,39 | ||||
| 2026-02-06 | 13F | HighTower Advisors, LLC | 10 583 | −71,86 | 139 | −80,09 | ||||
| 2026-02-13 | 13F | Axim Planning & Wealth | 4 118 492 | −5,85 | 54 282 | −33,18 | ||||
| 2026-02-12 | 13F | Skopos Labs, Inc. | 17 008 | 218 | ||||||
| 2026-02-17 | 13F | Balyasny Asset Management Llc | Call | 149 300 | −39,65 | 1 968 | −57,18 | |||
| 2026-02-10 | 13F | Fideuram Asset Management (Ireland) dac | 196 557 | 4 736 | ||||||
| 2026-02-17 | 13F | FIL Ltd | 1 402 092 | 2,88 | 18 480 | −26,98 | ||||
| 2026-01-20 | 13F | Independence Bank of Kentucky | 150 | 0,00 | 2 | −50,00 | ||||
| 2025-11-14 | 13F | Peak6 Llc | 0 | −100,00 | 0 | −100,00 | ||||
| 2026-02-13 | 13F | Carmignac Gestion | 76 985 | 22,84 | 1 015 | −12,81 | ||||
| 2026-02-12 | 13F | Jane Street Group, Llc | Call | 1 875 900 | −10,59 | 24 724 | −36,54 | |||
| 2026-02-12 | 13F | Jane Street Group, Llc | 23 258 | −93,91 | 307 | −95,69 | ||||
| 2026-02-17 | 13F | Advisory Services Network, LLC | 0 | −100,00 | 0 | |||||
| 2026-01-23 | 13F | Baillie Gifford & Co | 774 166 | 10 204 | ||||||
| 2026-02-12 | 13F | Jane Street Group, Llc | Put | 100 200 | −84,05 | 1 321 | −88,69 | |||
| 2026-02-17 | 13F | Susquehanna International Group, Llp | Call | 878 600 | −48,71 | 11 580 | −63,60 | |||
| 2026-02-19 | 13F | Invesco Ltd. | 39 123 | −2,29 | 516 | −30,69 | ||||
| 2026-02-17 | 13F | Susquehanna International Group, Llp | 2 730 600 | 53,97 | 35 989 | 9,28 | ||||
| 2026-02-17 | 13F | Susquehanna International Group, Llp | Put | 109 400 | −94,35 | 1 442 | −95,99 | |||
| 2026-02-18 | 13F | Vident Advisory, LLC | 125 388 | 1 653 | ||||||
| 2026-02-05 | 13F | Bank Julius Baer & Co. Ltd, Zurich | 1 000 | −0,10 | 13 | −27,78 | ||||
| 2026-02-14 | 13F | Rockefeller Capital Management L.P. | 1 538 | 20 | ||||||
| 2026-02-13 | 13F | Ubs Asset Management Americas Inc | 0 | −100,00 | 0 | −100,00 | ||||
| 2025-09-25 | NP | VFSNX - Vanguard FTSE All-World ex-US Small-Cap Index Fund Institutional Shares | 161 663 | 23,49 | 2 829 | 29,06 | ||||
| 2026-02-17 | 13F | Tiger Pacific Capital LP | 0 | −100,00 | 0 | |||||
| 2025-09-25 | NP | VT - Vanguard Total World Stock Index Fund ETF Shares | 32 268 | 35,10 | 565 | 41,00 | ||||
| 2026-02-10 | 13F | Goldman Sachs Group Inc | Put | 0 | −100,00 | 0 | −100,00 | |||
| 2026-02-06 | 13F | Gsa Capital Partners Llp | 0 | −100,00 | 0 | |||||
| 2026-02-12 | 13F | Federated Hermes, Inc. | 0 | −100,00 | 0 | |||||
| 2026-02-17 | 13F | Nomura Holdings Inc | 0 | −100,00 | 0 | |||||
| 2025-12-09 | 13F/A | Tudor Investment Corp Et Al | Call | 0 | −100,00 | 0 | −100,00 | |||
| 2026-01-29 | 13F | IMC-Chicago, LLC | 128 745 | −27,54 | 1 697 | −48,59 | ||||
| 2026-01-30 | 13F | Us Bancorp \de\ | 77 | 0,00 | 1 | 0,00 | ||||
| 2026-01-29 | 13F | IMC-Chicago, LLC | Put | 78 100 | −72,19 | 1 029 | −80,26 | |||
| 2026-02-17 | 13F | Balyasny Asset Management Llc | Put | 0 | −100,00 | 0 | ||||
| 2026-02-03 | 13F | Mitsubishi UFJ Kokusai Asset Management Co., Ltd. | 81 028 | 29,28 | 1 170 | 0,60 | ||||
| 2026-02-10 | 13F | Envestnet Asset Management Inc | 17 536 | 14,62 | 231 | −18,66 | ||||
| 2026-02-17 | 13F | KADENSA CAPITAL Ltd | 0 | −100,00 | 0 | |||||
| 2026-01-12 | 13F | Horizon Financial Services, Llc | 200 | 0,00 | 3 | −33,33 | ||||
| 2026-02-17 | 13F | Electron Capital Partners, LLC | 33 977 | −5,18 | 448 | −32,78 | ||||
| 2026-01-26 | 13F | Mirae Asset Global Investments Co., Ltd. | 1 859 | 2,31 | 25 | −27,27 | ||||
| 2025-11-14 | 13F | Wolverine Trading, Llc | 52 199 | 968 | ||||||
| 2025-11-14 | 13F | Wolverine Trading, Llc | Call | 107 600 | 1 996 | |||||
| 2025-11-14 | 13F | Wolverine Trading, Llc | Put | 74 200 | 1 376 | |||||
| 2026-02-17 | 13F | Point72 Asset Management, L.P. | Call | 183 000 | 2 412 | |||||
| 2026-02-17 | 13F | Point72 Asset Management, L.P. | 275 415 | 3 630 | ||||||
| 2026-02-17 | 13F | Point72 Asset Management, L.P. | Put | 86 400 | 1 139 | |||||
| 2025-11-14 | 13F | Natixis | 0 | −100,00 | 0 | |||||
| 2026-02-06 | 13F | Pnc Financial Services Group, Inc. | 0 | −100,00 | 0 |
Other Listings
| US:EH | 11,85 US$ |